Web Scraping laptops prices with BeautifulSoup
Recently I’ve been learning a new technology which is BeautifulSoup. A python module used for web scraping. So over the past days doing some tutorials and watching videos about web-scraping. I decided to choose BeautifulSoup it was the most used module used for the tutorials and videos that I saw. The first main tutorial I did was from the website realpython which gave a pretty good overview of web-scaping and also the requests library. In that tutorial, I had to scrape Wikipedia’s XTools to found out the most popular mathematicians on Wikipedia. A very odd project idea, I know. But was effective for getting me to the basics of the libraries. As had knowledge of HTML, it helped speed up the process of learning.
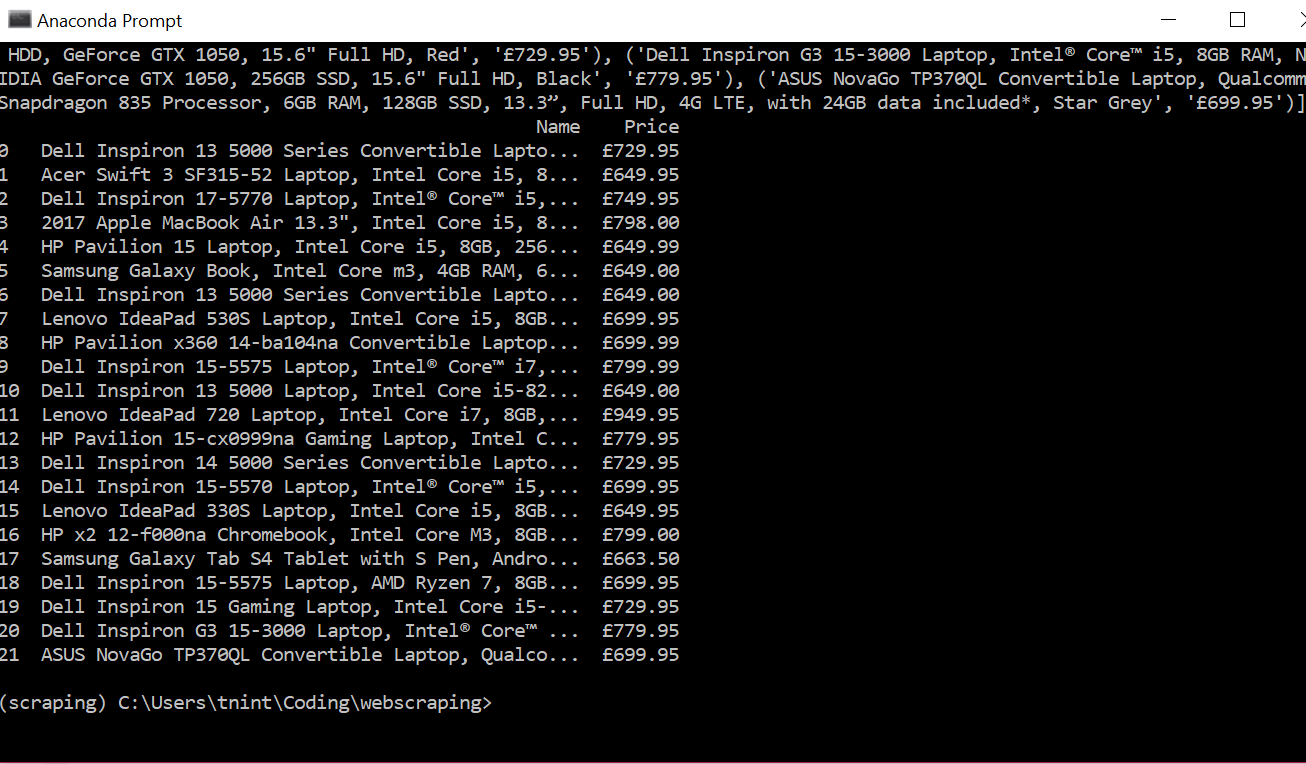
To test my skills decided to make a mini-project for myself where scrape prices for laptops. The reason why for this project I’m looking for new laptops so this project will prove helpful for my research. To start decided to used a different tutorial for my code from hackernoon.
from bs4 import BeautifulSoupimport requestsimport pandas as pdpage_link = "https://www.johnlewis.com/browse/electricals/laptops-macbooks/view-all-laptops-macbooks/price=600-800/_/N-a8fZ6lq8?showInStockOnly=false&sortBy=rating"#fetch content from urlpage_response = requests.get(page_link, timeout=5)# parse htmlpage_content = BeautifulSoup(page_response.content, "html.parser")The code was short and simple but unlike the code from the realpython tutorial did not have functions did catch errors from requests or use the functions to make the program more abstract but still readable. The goal of the solution is to extract the name of the laptop and the price, A very simple goal. Using the code from the hackernoon tutorial I noticed when printing the statements that it only printed HTML not the just the text. To fix this found another tutorial on youtube with showed to extract text from an HTML element. Sometimes the beautifulsoup functions are similar but do slightly different things, For example, find()vs find_all()the first only find one instance of the HTML element the second finds all as a list. After that using a for loop with the find_all() function helps extract the text of the laptop names and prices. I printed the text and appended them as a tuple to a list called records. Next using the pandas library I converted the list to a data frame which I then exported to an exported to a CSV for later use.
The project did not take to long and the code only ran up to 28 lines which surprised me. I think to show how much the requests and beautifulsoup libraries abstracted most of the complicated work away. Also helps I only extracted one page. In future projects may use something like selenium for non-static websites or use it to navigate multipage.
Visualising my music catalog with matplotlib
I have always wondered how my music catalogue would look like if visualised. Mainly wondered because when shuffling the music the same type of music got played. But I know I tried to make my music choices to more diverse. so I decided to cook up some code to analyse my music library.
First, I need a way to get the music in a table like a format, So I googled around and found that you can use this command dir > filenames.txt to quickly export filenames to a CSV file. But the exported file has a lot of info that was not needed for my project. Then I cleaned the data up by deleting the all the columns expect filenames. But instead, I opted for a different method as having a program called mp3tag which helps you add details to your music files like artists, album info and most importantly for me added album pictures to the file. The program has an option to export the files to a CSV file format. This file was cleaner with more relevant data like album or artist.

Which can be used for more use in the project if needed. Not just filenames. The main detail it lacked was the genre of the songs so I had to manually add them myself. this did not take to long maybe around a few hours.
After that, I decided to start coding the project. I based a good amount of my code on this medium post, as I did not how to use pie charts in matplotlib. First, I used pandas to read the CSV file to the script and the data massaging

Using after reading the CSV to the file I previewed the data with the head() function. Looking at the data I found duplicate genres from simple misspellings. So I fixed by going directly to the CSV file and editing out the issues. Next, I used the value_counts() function to print the frequency of each genre, from this I quickly found my music list is less diverse than I thought. Now, this needed to convert the data frames to a format that the matplotlib pie function to understand. To do this I converted the value_counts to lists. And separated by name of genres and the number of counts. This was done by using the .valuecounts().index().tolist() function the index()is used so you can extract the names so you have a list like this ["Kpop", "pop", "Rap", "Film"]To get the list with the numbers only you can omit the index()like this .value_counts().tolist()
Now you can print the variables to see if everything is all good. So you can move on to plotting the data. First, we define the colours of our pie chart. I picked the colours using a hex picker from google to did the colour scheme a minimal style look. Next, I turned the lists from earlier to numpy arrays so to can be used for the legend. This is because i had technical difficulties moving around the text of the percentages to prevent clumping up so found this solution to use a legend instead thanks to this StackOverflow article.
We make percentage variable and plot legends below:
percent = 100.*y/y.sum()
percent2 = 100.*y2/y2.sum()
patches, texts, = ax1.pie(y, colors=colors, startangle=90, radius=1.2)
patches2, texts2 = ax2.pie(y2, colors=colors, startangle=90, radius=1.2)
labels = [‘{0} — {1:1.2f} %’.format(i,j) for i,j in zip(x, percent)]
labels2 = [‘{0} — {1:1.2f} %’.format(i,j) for i,j in zip(x2, percent2)]
The labels are for the legend showing the percentage with the genre.
We apply another style charge to the pie charts by changing the text to grey:
for text in texts: text.set_color(‘grey’)This is the code that plots the legends to the figures:
for text in texts: text.set_color(‘grey’)This is the code that plots the legends to the figures:
sort_legend = True if sort_legend: patches, labels, dummy = zip(*sorted(zip(patches, labels, y), key=lambda x: x[2], reverse=True))]patches2, labels12, dummy2 = zip(*sorted(zip(patches2, labels2, y2), key=lambda x: x[2], reverse=True))ax1.legend(patches, labels, loc=’center left’, bbox_to_anchor=(-0.1, 1.), fontsize=8)ax2.legend(patches, labels2, loc=’center right’, bbox_to_anchor=(-0.1, 1.), fontsize=8)Then you should have some pie charts that look something like this:


My Machine Learning Challenge
This is a learning project I want to do for a while. The learning material will be based on Siraj Raval’s Learn Machine Learning in 3 Months video. He gives a clear road to becoming competent in machine learning. Have been playing with some of the coding challenges from the learn python for data science section so I won’t be doing this blind.
The first month is mainly math and theory-based, Before taking the MIT linear algebra course will be taking 3Blue1Brown’s Essence of linear algebra first to develop an intuition for the topic. So I don’t listen to the lectures with no clue of whats going on.
To be honest, I think can finish this project in less than 3 months as my summer holidays just started and I will be spending most of my time on this project. But I do get described easily by other learning projects, for example, I want to start an Instagram page to practice my photography and marketing skills(Growth Hacking) and improve my guitar skills or learn some new sports or hobbies. Too ambitious? :)
I will be trying to be blogging about this project every day to keep me accountable and also help improve my writing. I got this inspiration from Praxis 30 day blogging Challenge.